Monitoring AWS Costs
In-depth deployment planning and properly configured budgets are important tools, but they’re not enough. Just like smart security professionals will build layers of firewalls, permissions, and physical controls around their application infrastructure, account administrators will also watch events from multiple perspectives. Ongoing monitoring is a key part of that mix, and that means getting to know Amazon’s Cost Explorer and its cost and usage reports.
Cost Explorer
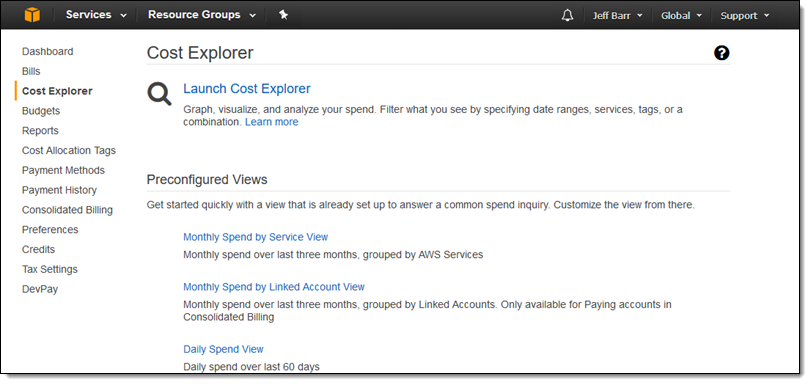
Cost Explorer lets you build graphs to visualize your account’s historical and current costs. If you’re in a hurry, you can select one of the preconfigured views provided by the service (including spending over the most recent three months by service).

Cost and Usage Reports
Cost and usage reports are (right now, at least) accessed from the Reports link on the Billing Dashboard. You can configure reports to be created that include the full range of activity on your account, including what resources you have running and how much they’re costing you. You can control for the level of detail and enable support for Redshift and/or Amazon QuickSight (a managed, pay-per-user business intelligence tool) to handle the visualization and analysis of what can become significant volumes of data.
Cost Allocation Tags
Resource tags: Resource tags are often used in busy accounts to help administrators quickly identify the purpose and owner of a particular running resource. With hundreds of instances, security groups, buckets, and service definitions scattered through your account, being able to instantly understand what each one is supposed to do will make it a lot easier for you to know how you should manage it.
Cost allocation tags: Cost tags are only meant to interact with billing tools and won’t show up in the context of any other AWS resource or process. Like resource tags, cost allocation tags help you efficiently identify your resources, but only for the purpose of tracking your account spending.